Validation NOAA
1. Introduction
Svašek Hydraulics has an extensive dataset of hindcasted wind and waves based on NOAA's wavewatch-3 model (NWW3)
The hindcast data is available from January 1997 up to present and consists of wave height, wave period, wind speed and wind direction. The model covers all oceans and most seas.
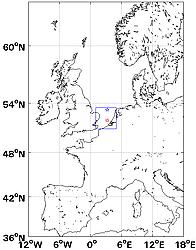
This memo presents the validation of the NOAA wind and wave hindcast data against observations at two locations in the North Sea. Since the dimensions of the North Sea are relatively small, the number of model grid is very limited here. The locations considered in this memo are not fully surrounded by wet grid points and hence may be disturbed by side effects.
Note that this validation does not refer to the NWW3 forecast data.
2. Data
2.1 Observations
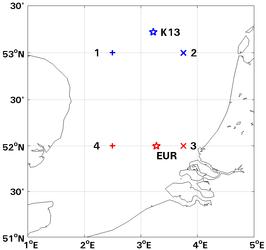
Wind and wave observations at two locations are considered, for the years 2001 and 2002 (available via www.knmi.nl and www.waterbase.nl):
|
|
The timeseries exist of hourly values, but have been converted to three-hourly values, by averaging over the data of the period stretching from one hour before till one hour after the time considered. Out of a total number of 5840, the number of values missing for the waves is 111 (for K13) and 1099 (for EUR). The wind series contain no gaps.
2.2 NOAA data
For a proper comparison with the observation platforms, the NOAA data will be based on interpolation between two grid locations.
|
|
 |
 |
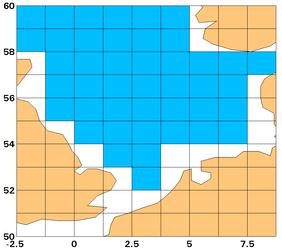 |
Note that locations 1, 2, 3 and 4 are not fully surrounded by wet grid points, hence they may be disturbed
by side effects.
The NWW3 timeseries exist of 5840 three-hourly values, covering the entire period 2001 - 2002.
3. Local variation in NOAA output locations and short time validation
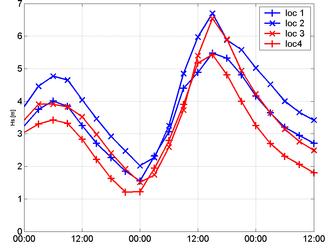
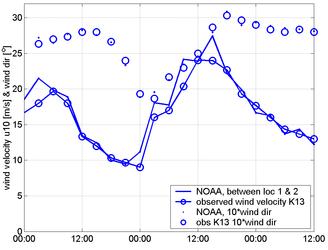
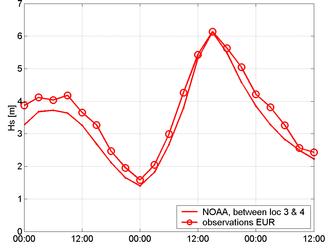
In October 2002 a severe WSW storm hit the North Sea, with wind velocities up to 25 m/s. The figures a) and b) below show for wind and waves the variation between locations 1-4 of the NWW3-model.
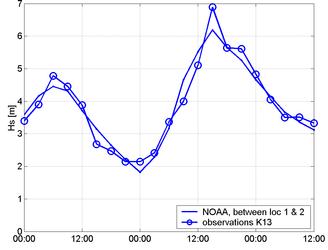
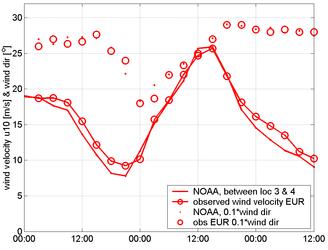
By interpolation between location 1 and 2 respectively 3 and 4 the hindcasted data for K13 and EUR is assessed so that the NWW3-model results can be compared with the observations. In figures c) and e) the wind velocity and wind direction of the model is compared with the observed wind. In figures d) and f) the computed waves are compared with the wave observations.
The agreement is good.
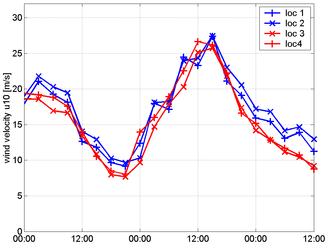
| a) NOAA wind: 26 - 28 Oct 2002 | b) NOAA waves: 26 - 28 Oct 2002 |
| c) NOAA wind: 26 - 28 Oct 2002 | d) NOAA waves: 26 - 28 Oct 2002 |
| e) NOAA wind: 26 - 28 Oct 2002 | f) NOAA waves: 26 - 28 Oct 2002 |
4. Long time comparison NOAA and observed wind and waves
4.1 Wind velocity U10 (10 min mean), years 2001 - 2002 at locations K13 and EUR
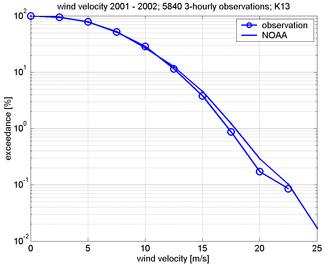
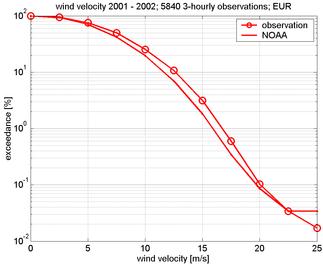
| wind velocity 2001-2002; 5840 3-hourly observations; K13 | wind velocity 2001-2002; 5840 3-hourly observations; EUR |
diff=(NOAA-obs)/obs
Conclusions:
At location K13 the agreement between the wind velocity of the NOAA hindcast en the observations is good.
At EUR, the NOAA model slightly underestimates the wind velocity. Note that - although in general the wind
velocity at K13 is higher than at EUR - both in the observations and in the hindcast the chances of wind
velocities exceeding 25 m/s are larger at EUR than at K13. Differences in wind velocity between hindcast
and observations for the given exceedence percentages are within 10%.
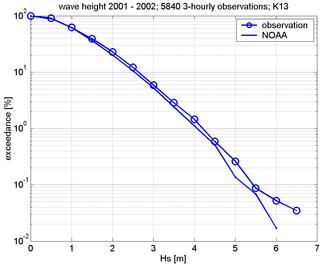
4.2 Waves years 2001 - 2002 at locations K13 and EUR
 |
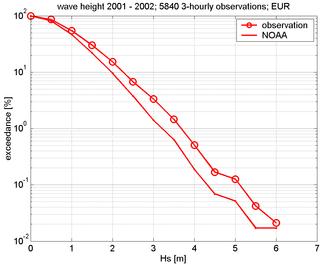 |
diff=(NOAA-obs)/obs
Conclusions:
At location K13 the agreement between NOAA and the observations of the significant wave height is good.
At EUR NOAA tends to underestimate the wave heights. This is in line with the fact that wind velocities
are also slightly underestimated by the model. The number of missing data of the observations at EUR is
large, so that the comparison is less reliable.